• Menu
  • Skip to left header navigation
  • Skip to right header navigation
  • Skip to main content

Before Header

http://www.birst.co.uk:8080/news.mp3
  • Facebook
  • Instagram
  • TikTok
  • Twitter
  • YouTube

Buzz

Journalism & News from Bournemouth University

  • News
    • Campus
    • Local
    • National
    • World
    • Entertainment
    • Lifestyle
    • Technology
    • Sustainability
  • Sport
    • AFC Bournemouth
    • Boxing
    • Cricket
    • Formula 1
    • Golf
    • Local Football
    • Men’s Football
    • Opinion & Analysis
    • Rugby League
    • Rugby Union
    • Tennis
  • Watch
    • Interactive
      • 2022 iDocs
      • 2021 iDocs
      • 2020 iDocs
      • 2019 iDocs
      • 2018 iDocs
      • 2017 iDocs
      • 2016 iDocs
      • 2015 iDocs
    • Documentary
      • 2018 Docs
      • 2017 Docs
      • 2016 Docs
      • 2015 Docs
      • 2014 Docs
  • Search
  • Elections
    • US2012
    • US2016
    • UK2015
    • UK2019
  • About
    • Authors
    • Archive
  • Sites
    • The Breaker
    • The Rock
  • News
    • Campus
    • Local
    • National
    • World
    • Entertainment
    • Lifestyle
    • Technology
    • Sustainability
  • Sport
    • AFC Bournemouth
    • Boxing
    • Cricket
    • Formula 1
    • Golf
    • Local Football
    • Men’s Football
    • Opinion & Analysis
    • Rugby League
    • Rugby Union
    • Tennis
  • Watch
    • Interactive
      • 2022 iDocs
      • 2021 iDocs
      • 2020 iDocs
      • 2019 iDocs
      • 2018 iDocs
      • 2017 iDocs
      • 2016 iDocs
      • 2015 iDocs
    • Documentary
      • 2018 Docs
      • 2017 Docs
      • 2016 Docs
      • 2015 Docs
      • 2014 Docs
  • Elections
    • US2012
    • US2016
    • UK2015
    • UK2019
  • About
    • Authors
    • Archive
  • Sites
    • The Breaker
    • The Rock

Mobile Menu

RADIO BULLETIN

http://www.birst.co.uk:8080/news.mp3

Web Tools: Google Maps


Google Maps Engine Exercise


A popular way to visualise data is to display it on a map (obviously this will only work if the data contains geographical information), the following exercise shows how to use the Google Maps Engine to easily plot your data on a map.

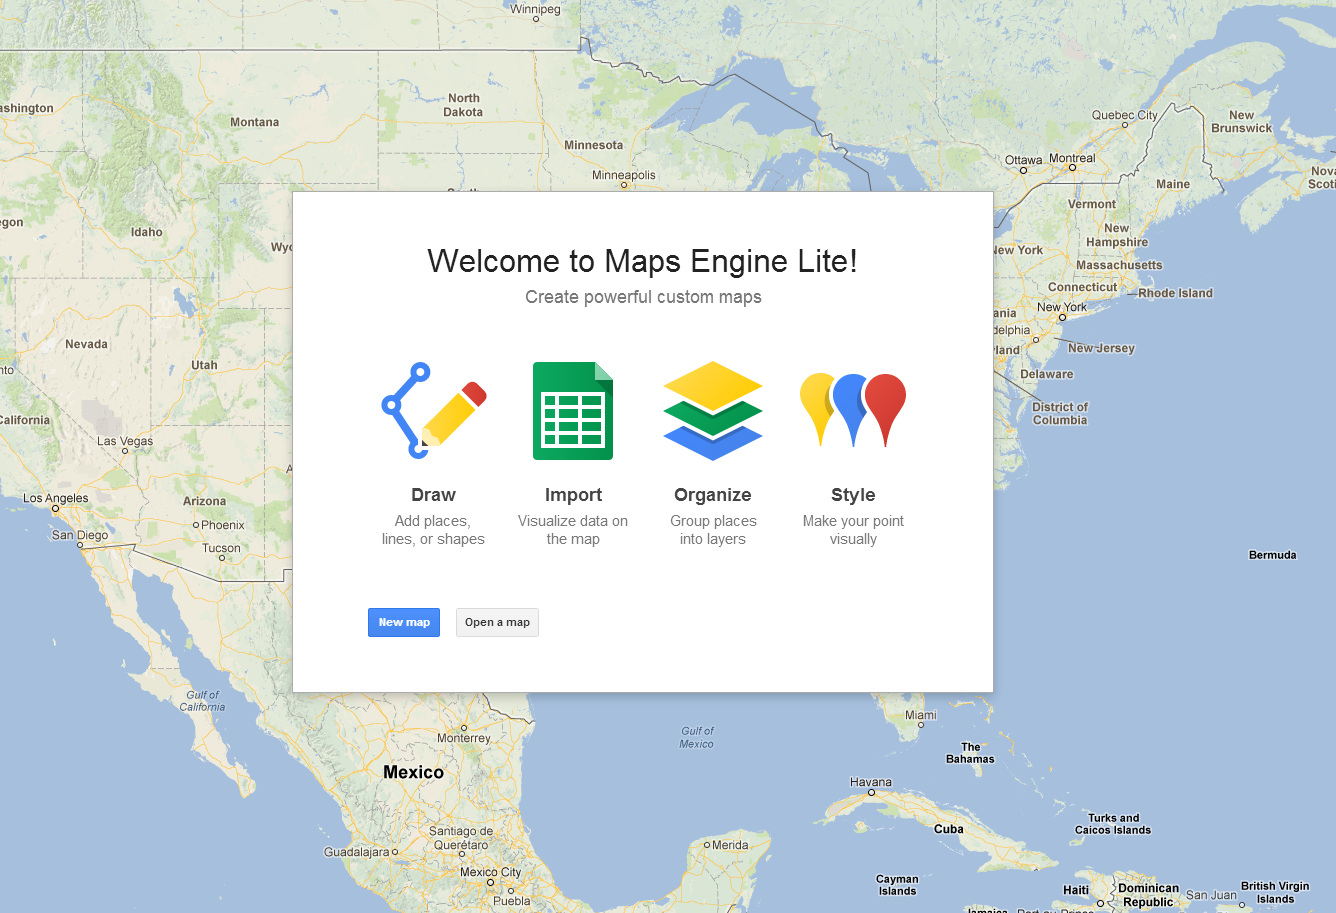
  1. Open Google Maps Engine and login
  2. Click on the ‘New Map’ Button
  3. Download the data to visualise on your map
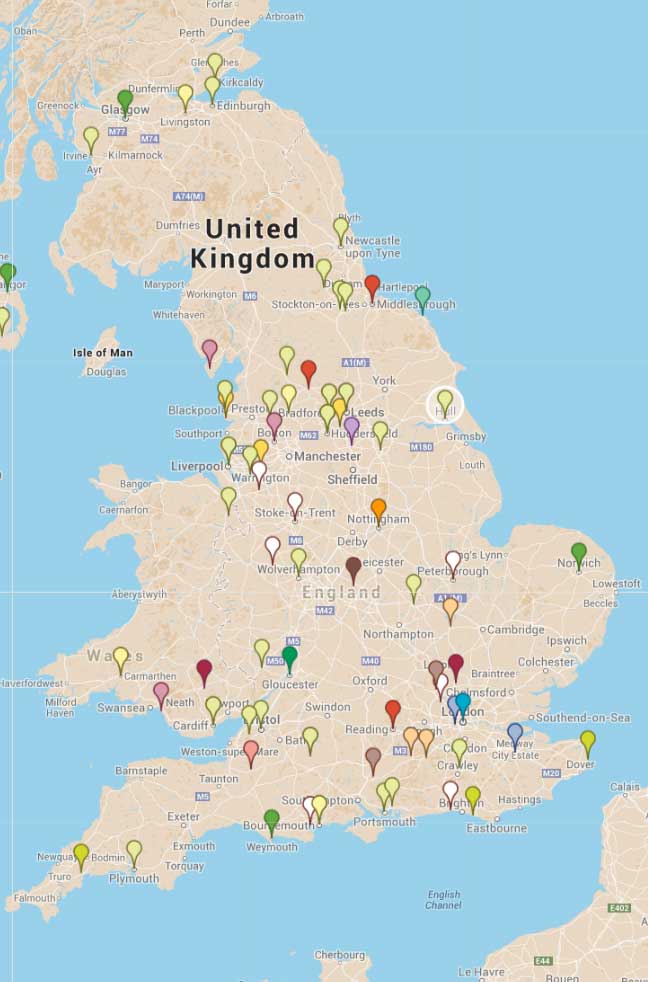
  4. Rename your map ‘British casualties in Afghanistan: 2011 – 2013’
  5. Click on the ‘Import’ link and upload your spreadsheet of Data
  6. In the ‘Choose columns to position your placemarks’ window, click on ‘Where From’ and select the ‘Continue’ button.
  7. In the ‘Choose a column to title your placemarks’ window, click on ‘Name’ and select the ‘Finish’ button.
  8. A warning should now come up advising that you have errors in your data – to fix, click on the Data link and in the spreadsheet that pops up all errors are marked in red. Adjust the location information so it is more precise e.g. add ‘UK’ to ‘Backwell, Somerset’
  9. Also, some locations are showing up in the wrong place. Find the misplaced locations and adjust the location information so it is more precise e.g. add ‘Scotland’ to ‘Irvine’
  10. Click on the ‘Style’ link and choose how you want your placemarks to look
  11. Click on the ‘Labels’ link and decide whether you want your placemarks to display labels
  12. Click on the ‘Base Map’ and select a style for your map
  13. Now your map is complete, to embed it on Buzz, first click on the green ‘Share’ button in the top right hand corner and set your map to ‘Public’. Next, click on the folder icon under the title, from the menu that pops up select ‘Embed on my site’ and copy and paste it into the ‘Text’ editor of your post.

Google Maps
Google Maps

DATA

Try another Google Maps Engine Tutorial with two layers of data.

Create a ‘Heat Map’ using Google Fusion Tables


Site Footer

  • Login
  • Privacy Policy
  • User Guides
  • Writer’s Guide

Copyright © 2023 Buzz · All Rights Reserved · Powered by Mai Theme